6523.0 - Household Income and Wealth, Australia, 2013-14  Quality Declaration
Quality Declaration ARCHIVED ISSUE Released at 11:30 AM (CANBERRA TIME) 30/03/2016
Page tools:
 Print Page Print Page
 Print All Print All
| |||||||||||||||||||||
|
Housing costs are often the largest regular expense for households. These costs directly affect the amount of income available to meet other living costs. In 2013-14, almost three-quarters (74%) of older low income households owned their home outright compared with less than one-fifth (18%) of younger households. The majority of people in younger low income households were either private renters or owners with a mortgage (65%). In contrast, 8% of older low income households were private renters, and 6% were owners with a mortgage (Graph 1). 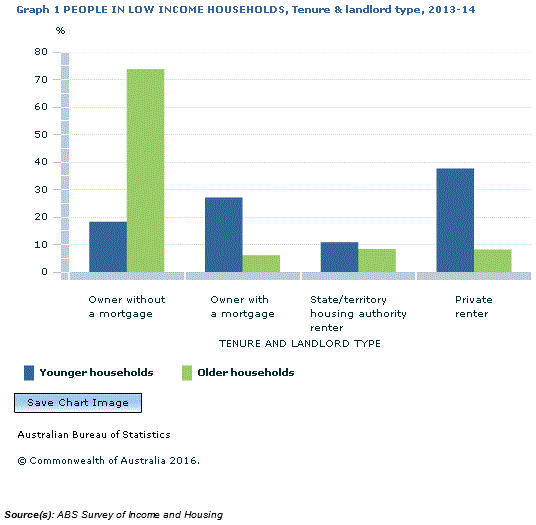 Source(s): ABS Survey of Income and Housing These higher home ownership rates for older households contributed to their average weekly housing costs being significantly lower than those of younger households ($106 and $216, respectively). Average housing costs were highest for younger households with a mortgage or renting privately (Graph 2).  Footnote(s): (a) Includes other renters and other tenure types Source(s): ABS Survey of Income and Housing The financial benefits a household receives from home ownership or paying subsidised rent can also be analysed by comparing an imputed market rent for their home and the actual housing costs they pay. The difference is called net imputed rent. It is nil for market renters and can be either positive or negative for other tenure types. For the latter, this will depend on whether their housing costs are higher or lower than the market rent that has been imputed for their home. If net imputed rent is added to disposable household income, more meaningful comparisons of the total economic circumstances of different tenure types can be undertaken. Table 1 shows the impact of defining the low income population using this alternative income measure including net imputed rent. The proportion of the low income population that had a household reference person under 65 years would increase from 69% to 81%.
Document Selection These documents will be presented in a new window.
|
||||||||||||||||||||
